Querying the blockchain is an efficient method to learn how a network works and get into the weeds of what’s happening on the ledger.
In this article, you will learn the fundamentals of the Solana on-chain data using Dune Analytics, the analytics platform that makes on-chain crypto data accessible and consumable.
With Dune, you can run SQL queries on different blockchains data, visualize the results in graphs that can be assembled in dashboards. These features are totally free.
To get started, go to dune.xyz, set up your account and you’ll be landing on the SQL interface, ready to run a query.
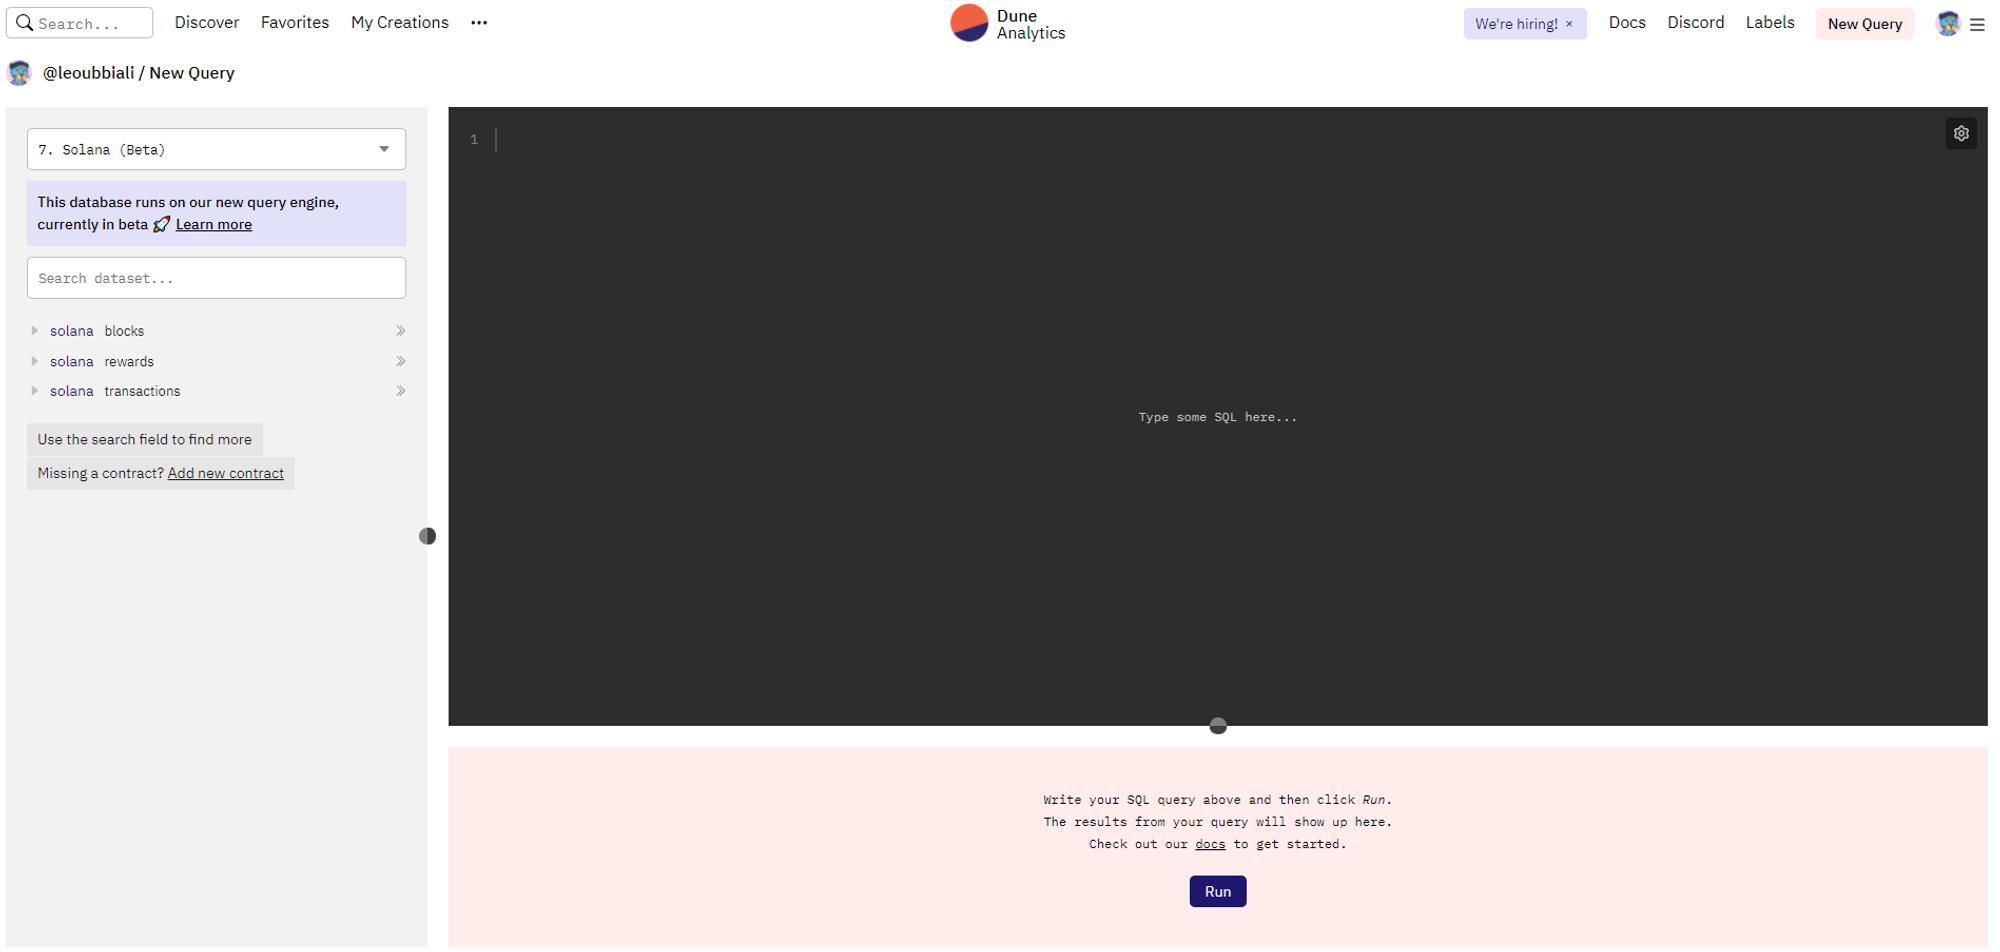
Given that blockchain data is inherently public, your SQL skills are the only limit to the analytical questions that can be answered on Dune. If you are a SQL newbie or you want to refresh your mind, check out these SQL guides.
The raw material - Solana tables
The first step to query blockchain data on Dune is understanding how the data is structured and organized.
Currently, Dune has released 3 raw tables for Solana:
- solana.blocks - the complete block history for the Solana ledger (full schema here).
- solana.transactions - the data for transactions. It includes account activity and programs called (full schema here). Vote transactions are not included.
- solana.rewards - rewards paid out on Solana (full schema here).
- solana.vote_transactions - vote transactions that are submitted by validators to vote on a block.
While we expect more abstract data models to come in the future, querying these datsets is an opportunity to understand the buildings block of the Solana ecosystem.
In the following paragraphs, we will look at sample queries and visualizations using the
transactions table. The logic and visualizations can be vastly applied to the other two entities.Dune Tables schema may change in the future. The queries of this post will be kept updated but if you run into syntax or semantic errors, check the current schema/naming convention of the tables
Getting started - querying transactions over time
How many transactions were produced yesterday? what’s the daily trend of transactions produced in the last 30 days?
These questions can be answered with a simple query and then visualized using either a bar chart or a line plot
select
    block_date,
    count(*) as transactions_count
from `solana`.`transactions`
where block_date > current_date() - interval '30 days'
and error is null --filter out error transsactions
group by 1
We filter the valid transactions of the last 30 days and group and them by date so that we can visualize a line plot that gives us an idea of the activity on the network in the last rolling 30 days.
Adding filters and breakdowns
The above query returns all the transactions that happened on the network. If you want to break down the transactions count by popular programs of the Solana ecosystem you can leverage additional conditions in the
where statement and conditional counting in the select statement.For instance, with the following query you can retrieve the count of transactions that happened in the last 30 days on 3 popolar NFT marketplaces: Solsea, Magic Eden and Solart.
select
     block_date,
     count(case when array_contains(account_keys, '617jbWo616ggkDxvW1Le8pV38XLbVSyWY8ae6QUmGBAU') then id else null end) solsea,
     count(case when array_contains(account_keys, 'MEisE1HzehtrDpAAT8PnLHjpSSkRYakotTuJRPjTpo8') then id else null end) magic_eden,
     count(case when array_contains(account_keys, 'CJsLwbP1iu5DuUikHEJnLfANgKy6stB2uFgvBBHoyxwz') then id else null end) solanart
from `solana`.`transactions`
where block_date > current_date() - interval '30 days'
and error is null -- filter out error transactions
group by 1
Visualizing the output on a line plot we can see the trend of the 3 different programs compared over time.
Making the query interactive with parameters
Manually encoding the program address and the number of days works but it’s not very flexible. You need to change your query every time that you want to pull a metric for a different program or you want to set a different timeframe. This friction is solved by Parameters.
Parameters are a powerful feature of the Dune query engine that let you implement a variable in your code whose value is inputted by the end user making the query and the related visualization interactive.
For example, the following query returns the number of transactions on a user inputted program address (handled by the
program_address program address ) in a timeframe that goes from a variable number of days in the past (handled by the number_of_days parameter) to the date of the query.select count(*) as transactions_count from solana.transactions where block_date > (current_date() - interval ' {{number_of_days}} days') and error is null and array_contains(account_keys, '{{program_code}}')
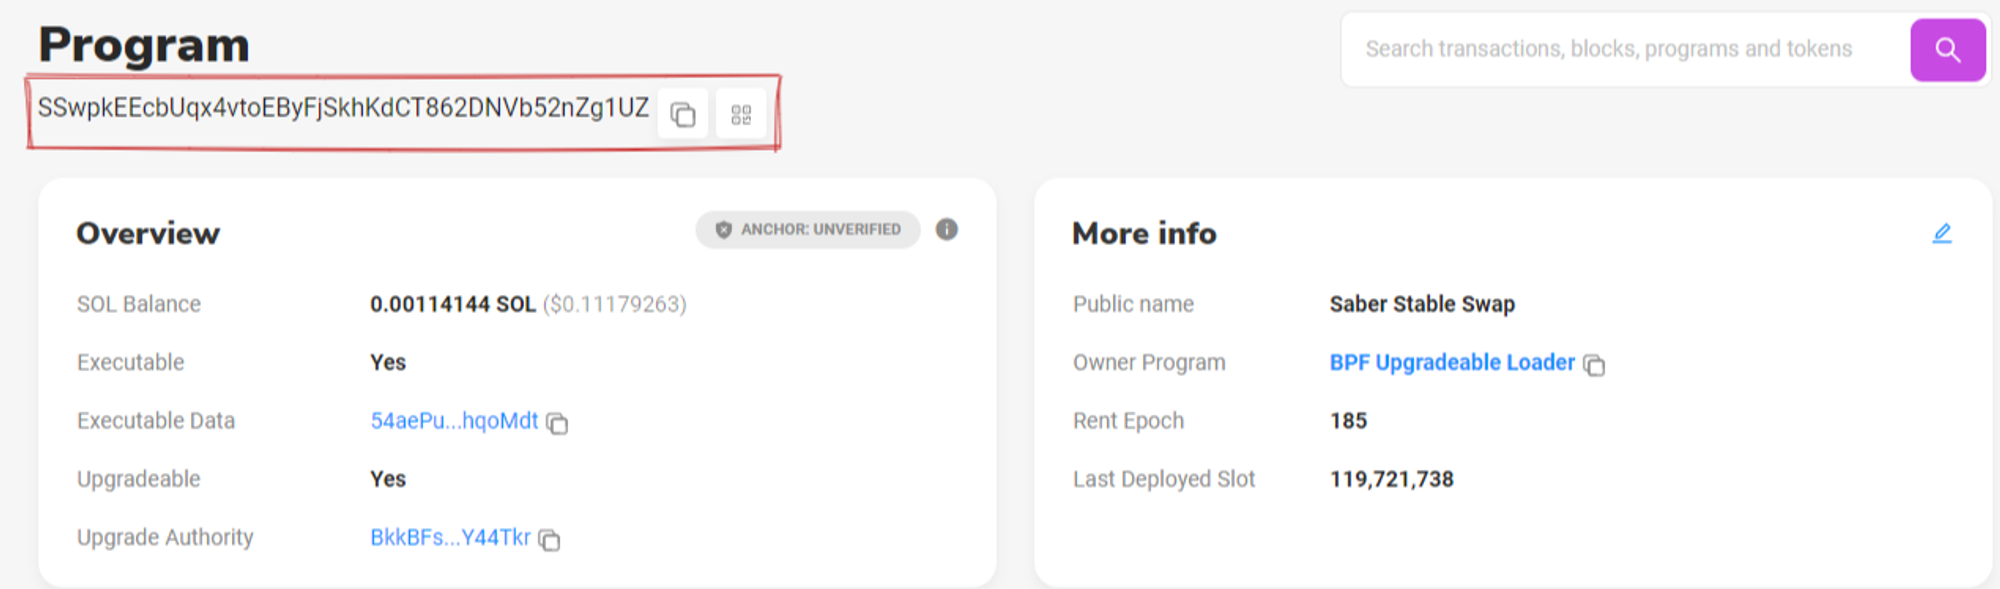
To retrieve the program address of a Solana project you can go to solscan.io, search the program and copy the address.
Here is an example for Saber Stable Swap , a Solana DeFi protocol.
Beyond the basics
Mastering SQL and getting familiar with the data schema will enable you to answer more complex analytical questions and build informative dashboards.
An effective way to learn and dig deeper is by looking at what other Dune wizards have already built: fork the query and amend it to answer your tailored questions. (it’s good practice to always credit the original authors when sharing their work).
You can explore what other wizards have built in the “Discover” section of the platform and bookmark with a star the dashboards that you plan to visit often.
Blockchain data is open and free and so it’s the intelligence built on top of that. It’s not by chance that Dune’s motto is: “the data must flow”.