this article first appeared on Saxifrage blog
When the news reports the number of patients in the hospital who have COVID, we know it’s those that are there because of COVID that matters. Yet digital channels like Google & Facebook report purchasers who have clicked on an ad, not those that purchased because of an ad.[1]
”It is difficult to get a man to understand something when his salary depends on his not understanding it”. - Upton Sinclair
If you want to move beyond digital tracking attribution, you need a method for independently measuring the impact of marketing spend, over what would have happened organically without it.
What’s the impact of our Facebook signup campaign? How effective is the 15$ discount coupon flyer? Is my offer targeted at people older than 65+ working?
Answering this type of question is essential to optimize the allocation of marketing investment with the ultimate objective of maximising the bank for the buck: double down on what drives outcome and stop or redesign what doesn’t work.
The problem with correlation
A naive approach to this analytical problem would be to look at the correlation between the intervention and the outcome (”we launched the campaign and gelato sales are up!! Party!”) but if you are reading this, you probably know that correlation does not imply causation. (”It’s 35 degrees and the sun is shining outside”)
So what? how can we look beyond correlation?
When it comes to estimating the causal impact of their initiatives, marketers can leverage Econometrics & Causal Inference methods to isolate the causal link.
We will introduce 3 techniques by looking at their non-technical intuition and typical use-cases. Assumptions, technical details and code are beyond the scope of this article but related resources are listed at the end.
Visualizing the problem - The Causal DAG
The simplified causal DAG (Directed Acyclic Graph) of the causal relationship between a marketing intervention and a business outcome looks like this.
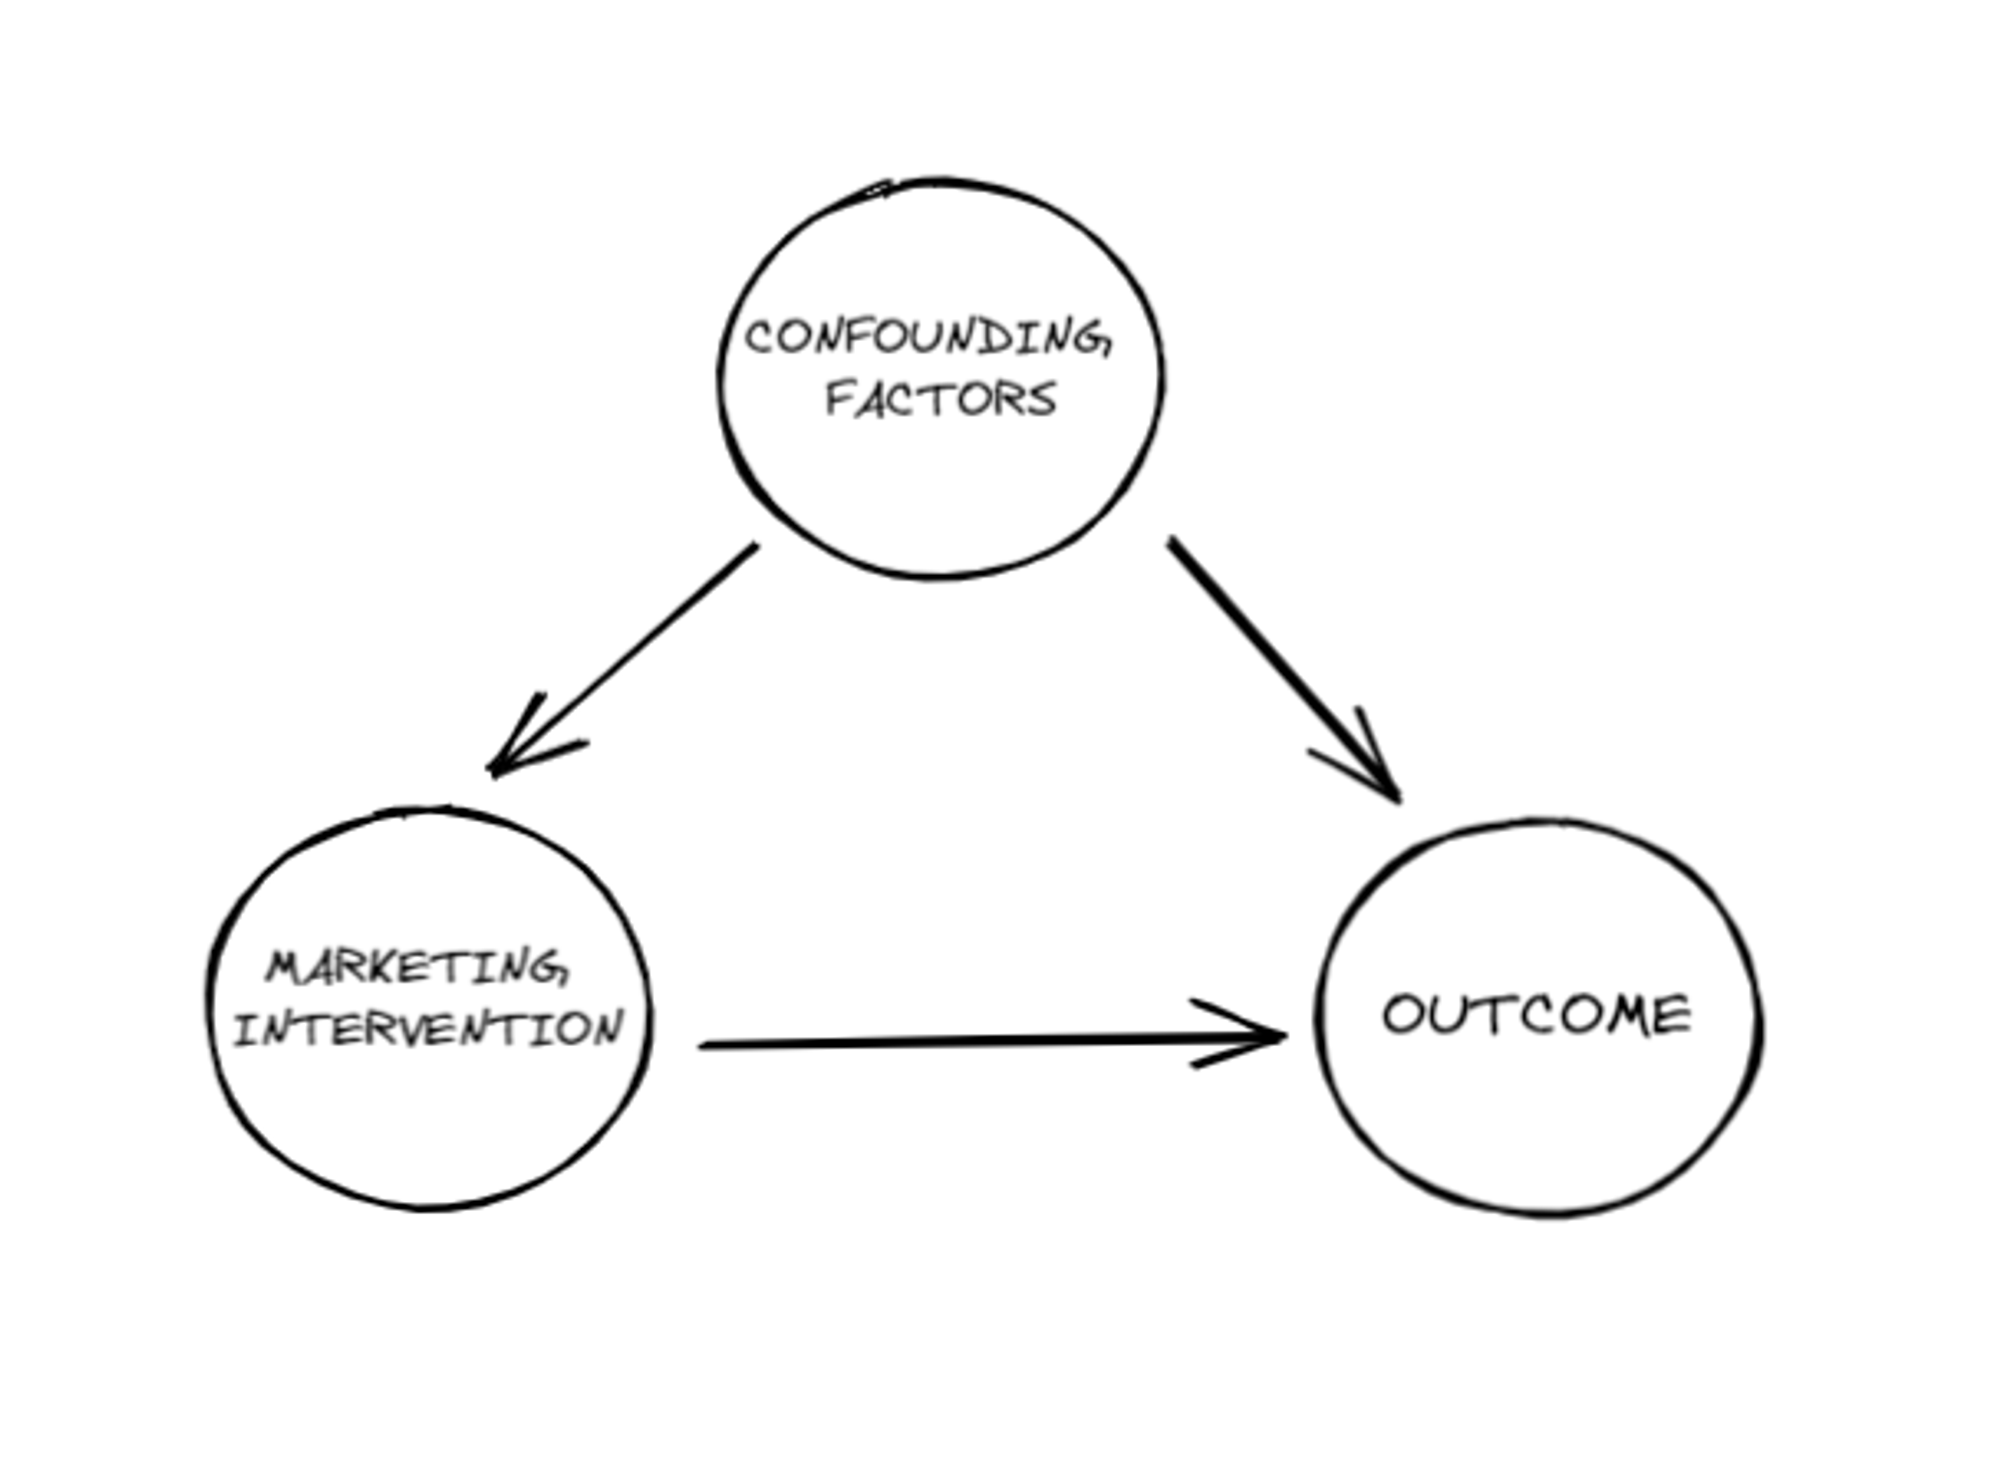
Each circle represents a variable (a.k.a. a factor) and each arrow represents a causal link.
Our goal is to isolate the causal link between the marketing intervention and the outcome by eliminating the effect of confounding factors (in Causal inference terms: “closing the backdoor path”)
Confounding factors are variables that affect both the outcome and the treatment (in our case, the marketing intervention).
As an example, let’s imagine that we are launching a branded paid search campaign and we are interested in its effect on sales. A confounding factor may be an Out Of Home Campaign which has both a direct effect on sales and an indirect effect on sales via paid search (”nice billboard, let me look up this brand on Google”)
The set of potential confounding factors is potentially very large and may encompass different domains (other marketing activities, psychographic and demographic traits, macroeconomic trends...) and sometimes cannot be properly measured (”unobserved confounders”).
The key to isolating the causal effect of the intervention of interest is holding all these factors constant to estimate the causal effect of the marketing intervention.
Solving the problem
The Gold Standard - Randomized Control Trials
The gold standard to estimate the causal impact of an intervention are Randomized Control Trials (a.k.a. “AB tests”, “lift tests”, “experiments”)
In an RCT, we randomly split the audience into a control and treatment group, show the advert only to the treatment group and then measure the difference in output between the groups over a given period of time.
Easy right? not exactly.
Randomly splitting the target audience into two groups and showing the ad only to one of them it’s impossible for Above The Line offline channels (i.e. Television, OOH, Radio, Print...) and become unviable in the digital ecosystem due to privacy backlash against surveillance capitalism and the consequent limitations in tracking (iOS 14.5, Cookie deprecation)
Experiments remain the viable and preferred solutions for direct marketing interventions such as CRM campaigns where the marketer has control over the mechanics of the campaign and the measurement of the results at a user level.
When RCTs are off the tables marketers can leverage two quasi-experimental methodologies to trying estimate the incrementality of the intervention: Geo-Experiments and Regression Discontinuity Design
Geo-Experiments
If we are not able to randomize the marketing intervention at a user level, we may try at a geographical level. That’s the main idea of Geo-experiments.
We create a test and control group made of non-overlapping Geos (state, region, city, zipcodes) so that we keep all other factors equal aside from the marketing intervention, which is served only in the test group Geos.
A classic example is splitting the United States into Designated Market Areas (DMA) and delivering the ad only on the areas part of the test group defined.
To measure the incremental impact of the intervention we then leverage econometrics methodologies such as Difference in Difference or Synthetic Controls.
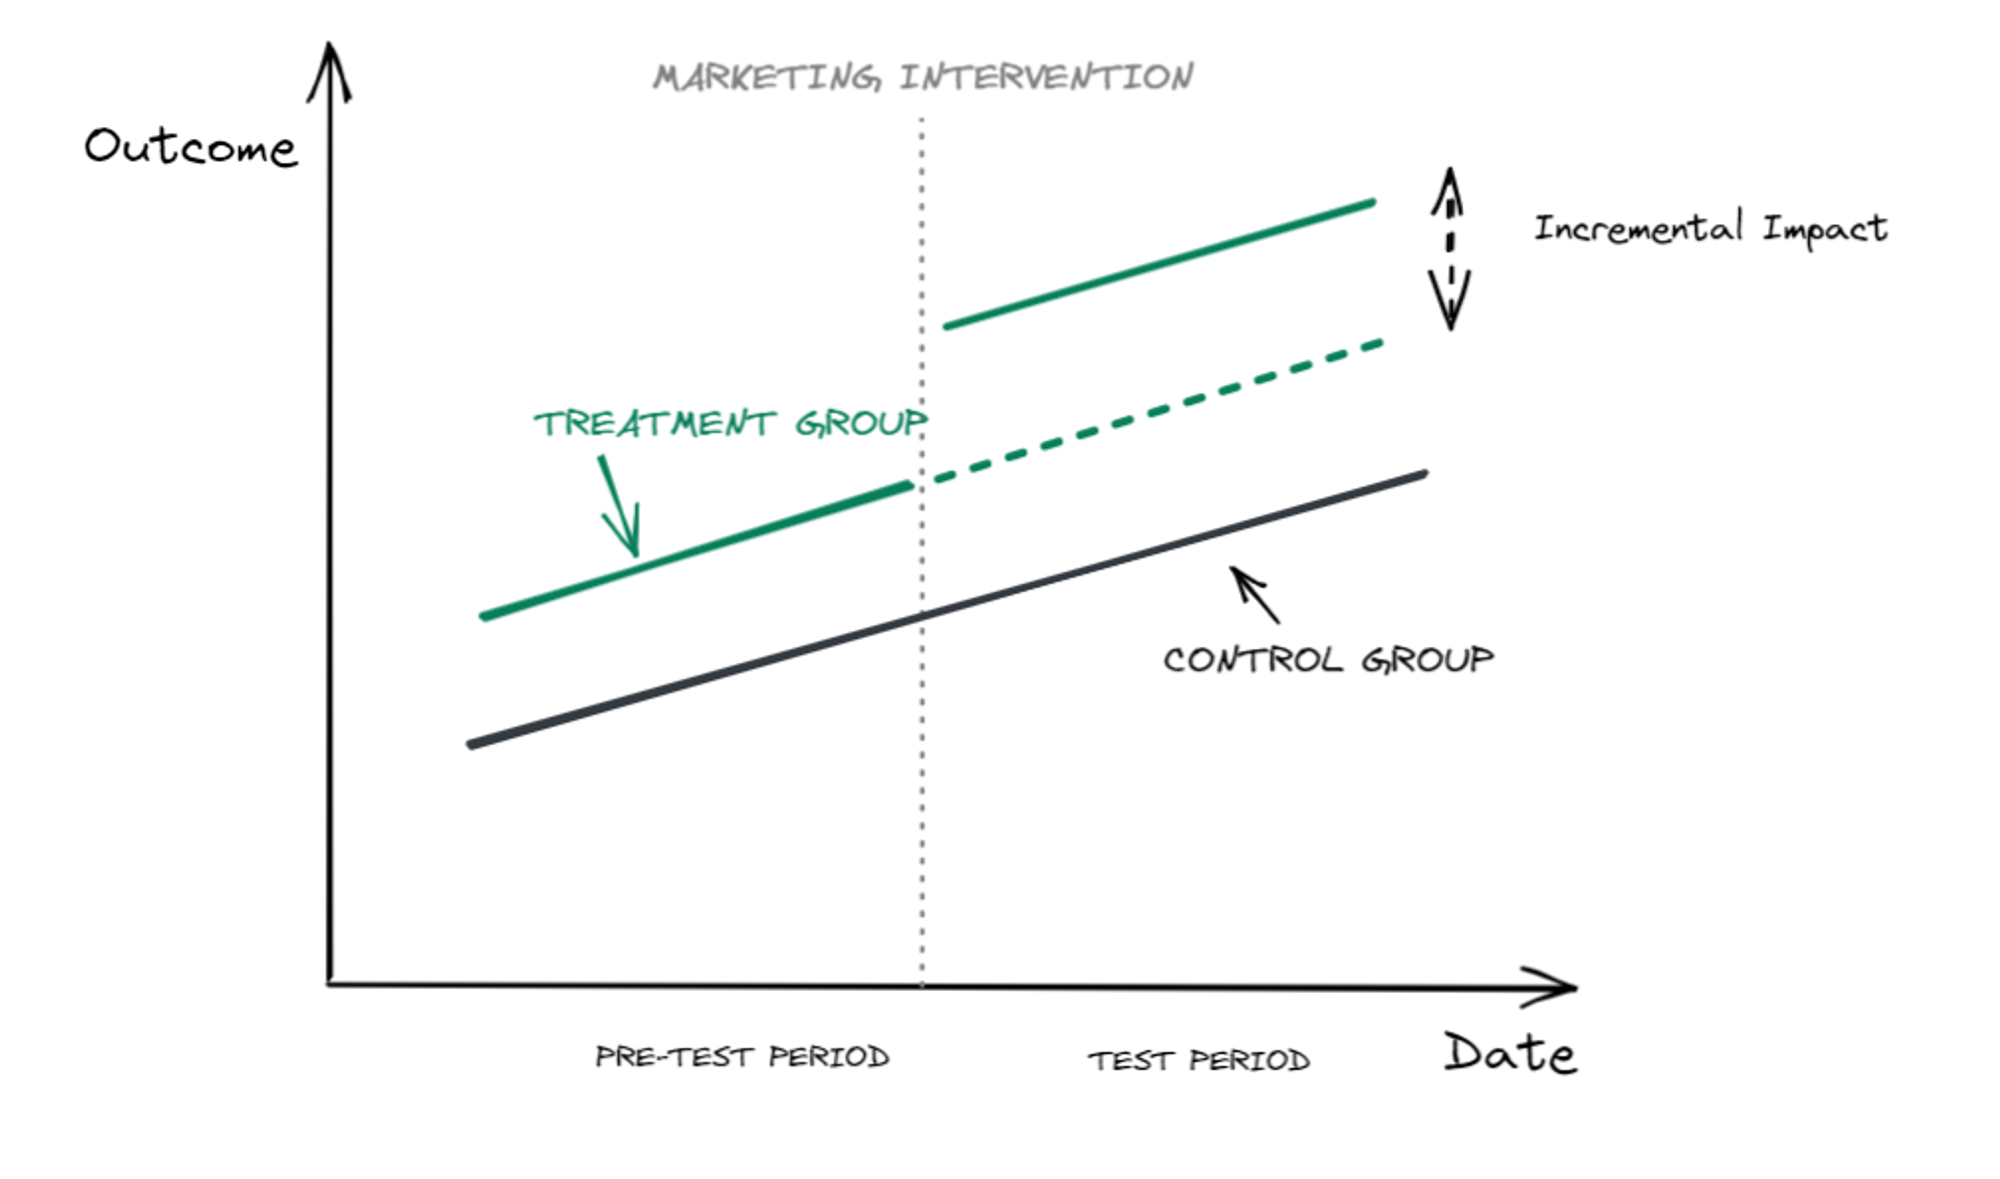
With these methods, we can estimate the counterfactual of the treatment group in the test period: what would have happened had the intervention not taken place.
By computing the difference between the actual treatment performance and the counterfactual we estimate the causal effect of the intervention on the outcome
Regression discontinuity
Geo-experiments are not always possible. Sometimes randomization at a Geo-level is not feasible or granular data volumes are too low.
If the treatment is assigned based on an arbitrarily cutoff threshold on a running variable we can exploit the Regression Discontinuity Design.
An example may be introducing a price differentiation (yes, pricing is a marketing lever) between people younger and older than 65 years old: people older than the threshold get a discount.
The intuition is fairly simple: we can identify the causal effect for those subjects whose age is in close neighbourhood around the 65 cutoff. If there is a “Jump” in the outcome around the cutoff would imply a causal impact of the intervention
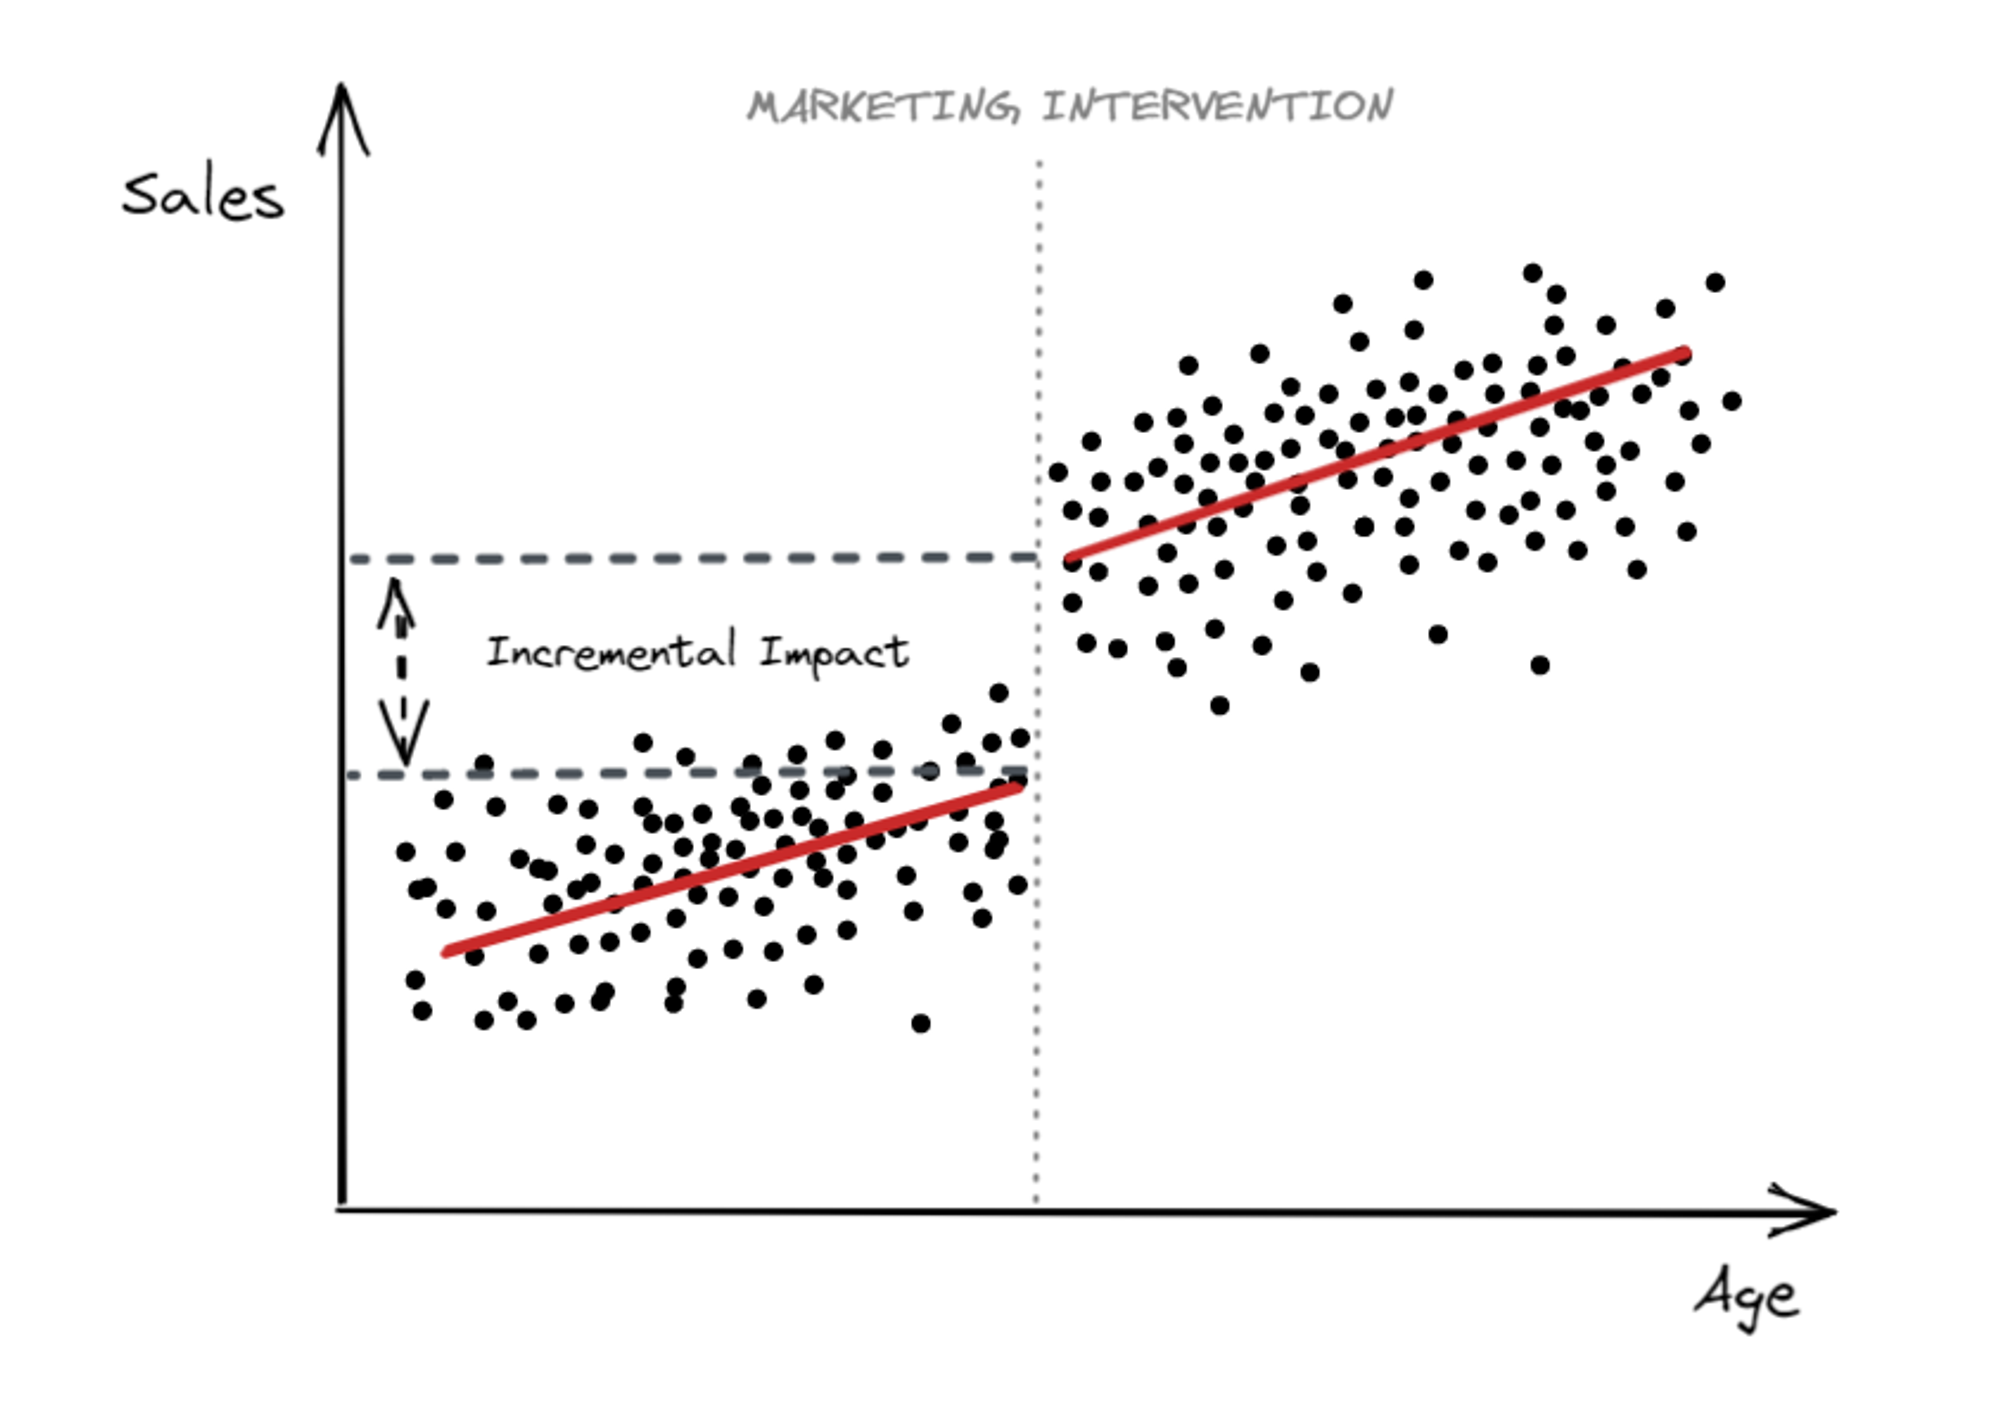
in the graph above, each point represents a user. The X-axis is the age of the user, the y-axis is the outcome (Sales).
The vertical distance between the two lines of best fit around the cutoff (65 years old) is the incrementality caused by the intervention
A variation of this causality identification framework very common in the marketing domain is the Regression discontinuity in Time (RDiT) design where the running variable on the X-axis is a time series (minutes, hours, days...).
Coming back to the paid search example, we can use RDiT to estimate the incremental impact of the branded bidding on Landing Page pageviews (picked as a leading indicator of Sales or another business outcome due to higher volume and lower variability per minute)
More strings to the marketer’s bow
These are only a subset of the methods that can be used for estimating the causal impact of marketing activities.
Other typical frameworks are Instrumental Variables, Uplift Modeling and Marketing Mix Modeling with the latest being used to measure multiple aggregated interventions consistently over time (i.e. “what’s the impact of all my channels over time”).
If you are interested in learning more about these methods and exploring R/Python packages to get your hands dirty, check out the Marketing Science Knowledge Repository: a curated database with Marketing Science resources (packages, papers, article, tools).
Resources
- Causal Inference in economics and marketing (Hal R.Varian)
- Conversion Lift tests are Dead; Transitioning to Geo-Experiments (Mack Grenfell & Leo Ubbiali)
- Identifying Causal Marketing-Mix Effects Using a Regression Discontinuity Design (Wesley R. Hartmann, Harikesh S. Nair, Sridhar Narayanan)